← Back to FundedSyncNet profit$1,422,859.20 Profit factor1.31 Winning trades43.85% Max drawdown−$45,172.10 NinjaTrader export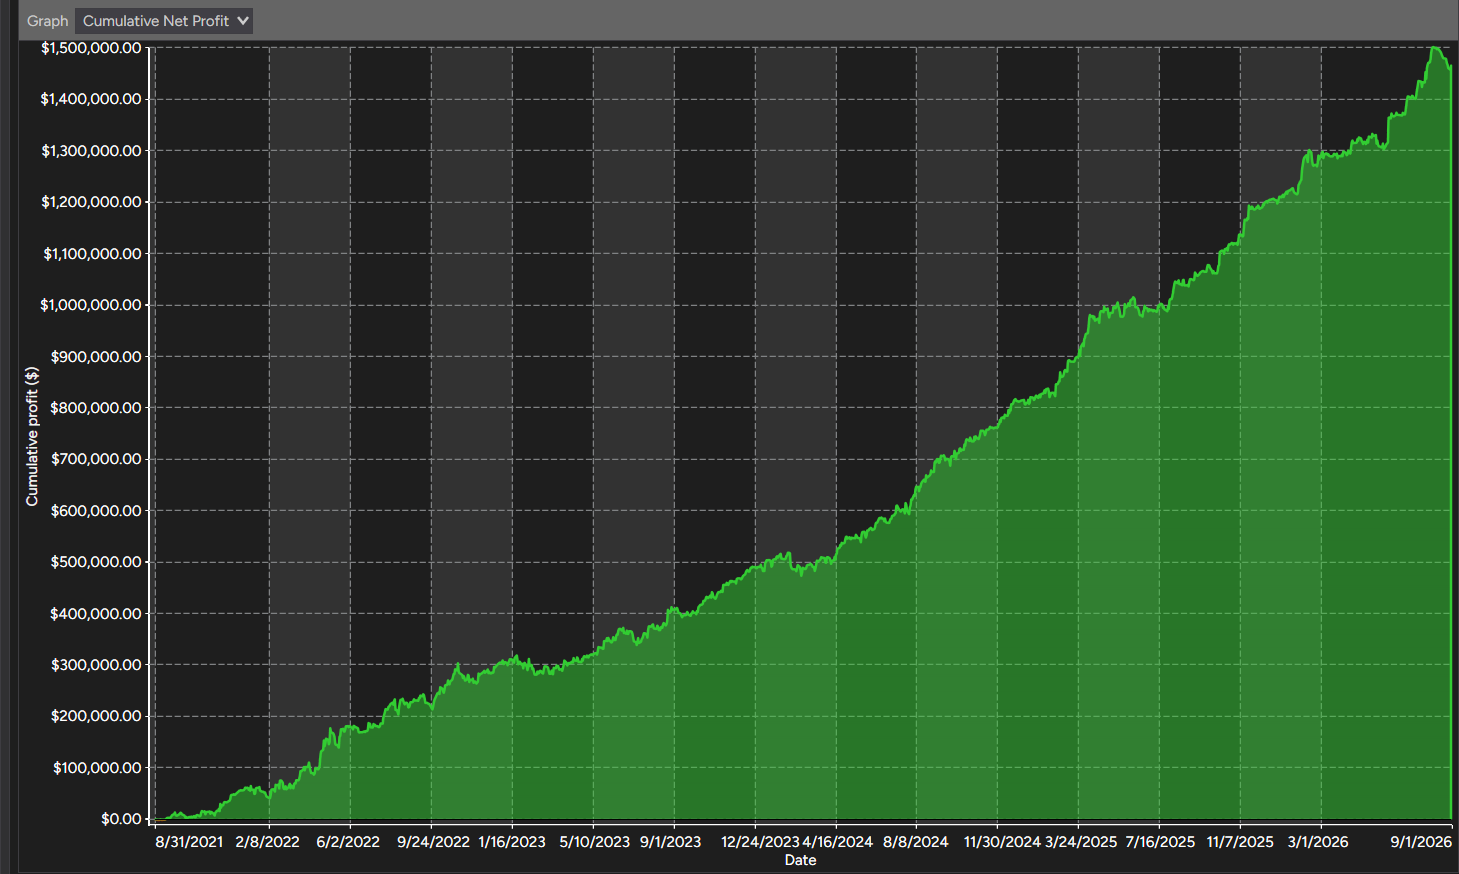
25K sizing preset
50K sizing preset
100K sizing preset
150K sizing preset
FUNDEDSYNC STACK · COMBINED PORTFOLIO
Advanced testing results
All 14 strategy engines in one portfolio. Review the combined equity curve, testing periods, yearly results, and each engine’s contribution.
Reference sizing profile150K2021-08-01 — 2026-09-0131,854 closed trades · 14 engines
FULL PORTFOLIO
Combined equity curve
Original combined NinjaTrader equity-curve image. Tap or click the chart to open it full size.
TESTING WINDOWS
Results by period
AUG 2024 — SEP 2026
Out-of-sample period
$835,133.30Trades12,754Win rate45.18%Profit factor1.41Max drawdown−$43,664Avg. trade$65.48Active sessions582
MAR 2026 — SEP 2026
Recent backtest period
$175,766.60Trades2,870Win rate44.70%Profit factor1.32Max drawdown−$43,664Avg. trade$61.24Active sessions135
Period results are slices of the same combined historical export, using the August 2024 out-of-sample and March 2026 recent-period boundaries.
ENGINE BREAKDOWN
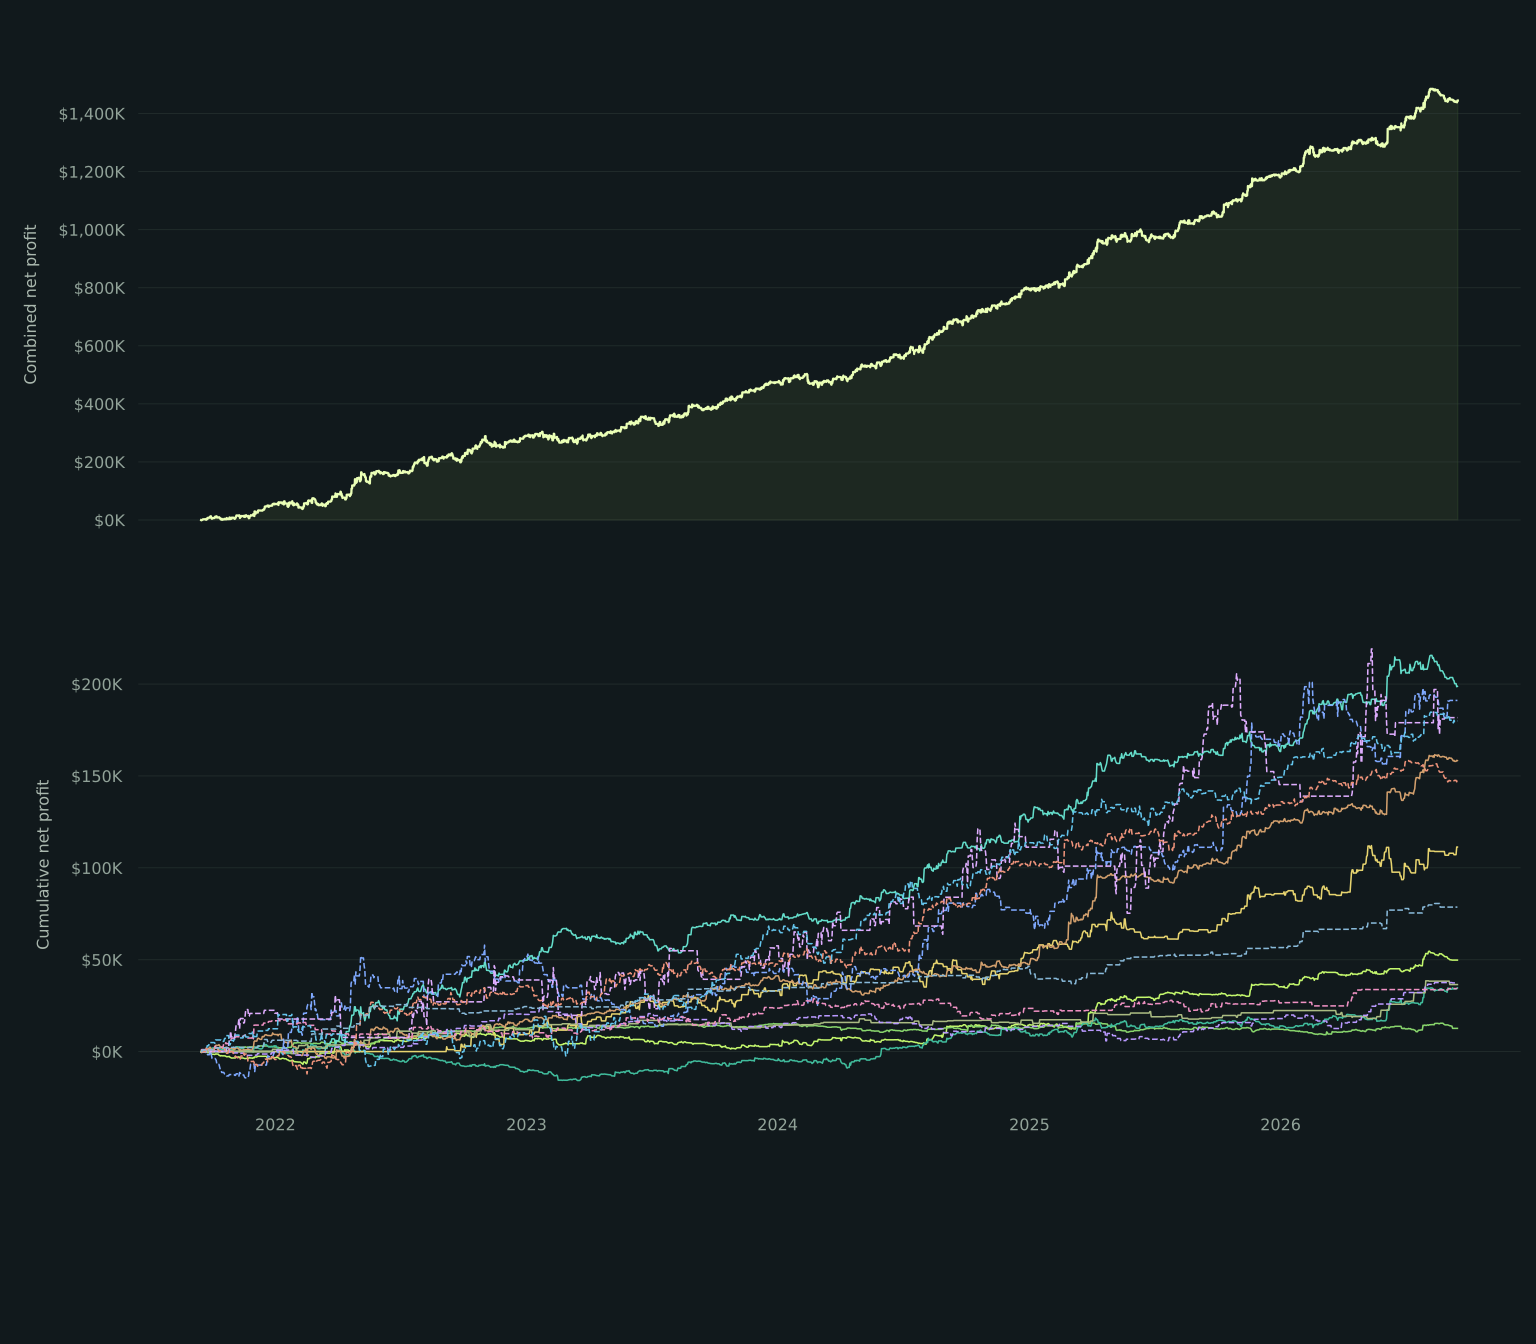
All 14 strategy curves
Fourteen original engine curves on one chart.
Strategy AStrategy BStrategy CStrategy DStrategy EStrategy FStrategy GStrategy HStrategy IStrategy JStrategy KStrategy LStrategy MStrategy N
The original engine curves are shown together without smoothing or reconstruction from monthly averages.
RISK PROFILE
Portfolio drawdown
Calculated from daily cumulative portfolio equity. Largest peak-to-trough decline: −$45,172.10.
YEAR BY YEAR
Annual performance
| Year | Trades | Win rate | Net profit | Profit factor | Max drawdown | Active sessions |
|---|---|---|---|---|---|---|
| 2021 | 2,235 | 40.45% | $59,829.90 | 1.29 | −$11,626 | 115 |
| 2022 | 6,065 | 42.61% | $243,344.20 | 1.25 | −$39,934 | 277 |
| 2023 | 6,845 | 44.30% | $174,198.30 | 1.20 | −$36,006 | 278 |
| 2024 | 6,678 | 43.53% | $305,586.20 | 1.33 | −$45,172 | 282 |
| 2025 | 6,250 | 45.07% | $382,094.90 | 1.39 | −$38,128 | 282 |
| 2026 | 3,781 | 45.62% | $257,805.70 | 1.37 | −$43,664 | 179 |
2021$59,829.90
Trades2,235Win rate40.45%Profit factor1.29Max drawdown−$11,626Active sessions115
2022$243,344.20
Trades6,065Win rate42.61%Profit factor1.25Max drawdown−$39,934Active sessions277
2023$174,198.30
Trades6,845Win rate44.30%Profit factor1.20Max drawdown−$36,006Active sessions278
2024$305,586.20
Trades6,678Win rate43.53%Profit factor1.33Max drawdown−$45,172Active sessions282
2025$382,094.90
Trades6,250Win rate45.07%Profit factor1.39Max drawdown−$38,128Active sessions282
2026$257,805.70
Trades3,781Win rate45.62%Profit factor1.37Max drawdown−$43,664Active sessions179
ENGINE DETAILS
Results by strategy
| Strategy | Trades | Win rate | Net profit | Profit factor | Avg. trade | Max drawdown |
|---|---|---|---|---|---|---|
| Strategy A | 4,796 | 35.63% | $44,003.50 | 1.17 | $9.18 | −$10,356 |
| Strategy B | 1,474 | 44.30% | $12,099.00 | 1.11 | $8.21 | −$6,812 |
| Strategy C | 2,987 | 41.98% | $33,201.80 | 1.11 | $11.12 | −$18,484 |
| Strategy D | 1,987 | 48.16% | $203,574.50 | 1.46 | $102.45 | −$13,966 |
| Strategy E | 1,665 | 53.99% | $106,423.80 | 1.25 | $63.92 | −$18,717 |
| Strategy F | 6,496 | 37.65% | $152,841.70 | 1.33 | $23.53 | −$12,673 |
| Strategy G | 435 | 41.15% | $36,681.30 | 1.57 | $84.32 | −$4,417 |
| Strategy H | 3,253 | 44.08% | $180,863.40 | 1.20 | $55.60 | −$46,775 |
| Strategy I | 577 | 52.86% | $37,689.60 | 1.30 | $65.32 | −$17,403 |
| Strategy J | 950 | 52.95% | $35,670.00 | 1.22 | $37.55 | −$11,053 |
| Strategy K | 1,917 | 52.43% | $171,237.50 | 1.45 | $89.33 | −$24,774 |
| Strategy L | 1,902 | 45.16% | $186,406.20 | 1.41 | $98.01 | −$28,285 |
| Strategy M | 3,089 | 51.21% | $144,131.00 | 1.28 | $46.66 | −$13,756 |
| Strategy N | 326 | 56.44% | $78,035.90 | 2.46 | $239.37 | −$9,445 |
Strategy A$44,003.50
Trades4,796Win rate35.63%Profit factor1.17Avg. trade$9.18Max drawdown−$10,356
Strategy B$12,099.00
Trades1,474Win rate44.30%Profit factor1.11Avg. trade$8.21Max drawdown−$6,812
Strategy C$33,201.80
Trades2,987Win rate41.98%Profit factor1.11Avg. trade$11.12Max drawdown−$18,484
Strategy D$203,574.50
Trades1,987Win rate48.16%Profit factor1.46Avg. trade$102.45Max drawdown−$13,966
Strategy E$106,423.80
Trades1,665Win rate53.99%Profit factor1.25Avg. trade$63.92Max drawdown−$18,717
Strategy F$152,841.70
Trades6,496Win rate37.65%Profit factor1.33Avg. trade$23.53Max drawdown−$12,673
Strategy G$36,681.30
Trades435Win rate41.15%Profit factor1.57Avg. trade$84.32Max drawdown−$4,417
Strategy H$180,863.40
Trades3,253Win rate44.08%Profit factor1.20Avg. trade$55.60Max drawdown−$46,775
Strategy I$37,689.60
Trades577Win rate52.86%Profit factor1.30Avg. trade$65.32Max drawdown−$17,403
Strategy J$35,670.00
Trades950Win rate52.95%Profit factor1.22Avg. trade$37.55Max drawdown−$11,053
Strategy K$171,237.50
Trades1,917Win rate52.43%Profit factor1.45Avg. trade$89.33Max drawdown−$24,774
Strategy L$186,406.20
Trades1,902Win rate45.16%Profit factor1.41Avg. trade$98.01Max drawdown−$28,285
Strategy M$144,131.00
Trades3,089Win rate51.21%Profit factor1.28Avg. trade$46.66Max drawdown−$13,756
Strategy N$78,035.90
Trades326Win rate56.44%Profit factor2.46Avg. trade$239.37Max drawdown−$9,445
SMALLER TRADE SIZES
Safer sizing profiles
Each profile has its own profit, drawdown, yearly, testing-period, and strategy results.
The 14-engine equity-curve display above remains unchanged. The figures in each profile section come from that profile’s own NinjaTrader trade export.
TRADE-SIZING PROFILE
25K
Net profit$241,292.50
Maximum drawdown−$8,303.90
Profit factor1.32
Winning trades50.93%
Closed trades12,799
Active sessions1,348
Results by testing period
AUG 2024 — SEP 2026
Out-of-sample period
$142,976.40Max drawdown−$7,429.20Win rate52.76%Profit factor1.44Closed trades5,116Average trade$27.95Active sessions559
MAR 2026 — SEP 2026
Recent backtest period
$29,949.60Max drawdown−$6,850.00Win rate53.48%Profit factor1.34Closed trades1,135Average trade$26.39Active sessions132
The recent backtest window is included within the out-of-sample date range.
Annual performance
| Year | Net profit | Trades | Win rate | Profit factor | Max drawdown | Active sessions |
|---|---|---|---|---|---|---|
| 2021 | $14,229.30 | 830 | 49.04% | 1.44 | −$1,631.40 | 110 |
| 2022 | $36,379.30 | 2,368 | 49.54% | 1.24 | −$6,454.30 | 262 |
| 2023 | $31,018.80 | 2,796 | 50.32% | 1.22 | −$8,083.40 | 264 |
| 2024 | $51,129.50 | 2,804 | 50.64% | 1.34 | −$8,303.90 | 268 |
| 2025 | $63,778.70 | 2,518 | 52.50% | 1.41 | −$7,429.20 | 270 |
| 2026 | $44,756.90 | 1,483 | 53.27% | 1.41 | −$6,850.00 | 174 |
2021$14,229.30
Trades830Win rate49.04%Profit factor1.44Max drawdown−$1,631.40Active sessions110
2022$36,379.30
Trades2,368Win rate49.54%Profit factor1.24Max drawdown−$6,454.30Active sessions262
2023$31,018.80
Trades2,796Win rate50.32%Profit factor1.22Max drawdown−$8,083.40Active sessions264
2024$51,129.50
Trades2,804Win rate50.64%Profit factor1.34Max drawdown−$8,303.90Active sessions268
2025$63,778.70
Trades2,518Win rate52.50%Profit factor1.41Max drawdown−$7,429.20Active sessions270
2026$44,756.90
Trades1,483Win rate53.27%Profit factor1.41Max drawdown−$6,850.00Active sessions174
Results by strategy
| Strategy | Trades | Win rate | Net profit | Profit factor | Average trade | Max drawdown |
|---|---|---|---|---|---|---|
| Strategy A | 0 | 0.00% | $0.00 | 0.00 | $0.00 | $0.00 |
| Strategy B | 1,166 | 42.37% | $4,515.20 | 1.11 | $3.87 | −$2,475.80 |
| Strategy C | 2,161 | 42.43% | $19,090.20 | 1.19 | $8.83 | −$4,541.50 |
| Strategy D | 1,040 | 55.77% | $24,102.50 | 1.41 | $23.18 | −$2,703.00 |
| Strategy E | 1,236 | 58.33% | $26,396.20 | 1.32 | $21.36 | −$3,072.00 |
| Strategy F | 0 | 0.00% | $0.00 | 0.00 | $0.00 | $0.00 |
| Strategy G | 224 | 52.23% | $10,403.80 | 1.81 | $46.45 | −$1,107.00 |
| Strategy H | 1,715 | 40.64% | $27,781.50 | 1.21 | $16.20 | −$8,366.40 |
| Strategy I | 330 | 53.03% | $3,587.00 | 1.22 | $10.87 | −$2,756.30 |
| Strategy J | 717 | 59.14% | $9,732.60 | 1.28 | $13.57 | −$2,498.10 |
| Strategy K | 957 | 50.89% | $25,887.50 | 1.44 | $27.05 | −$3,539.20 |
| Strategy L | 1,374 | 55.17% | $51,250.00 | 1.44 | $37.30 | −$7,971.70 |
| Strategy M | 1,691 | 60.85% | $24,027.90 | 1.30 | $14.21 | −$2,432.20 |
| Strategy N | 188 | 63.83% | $14,518.10 | 2.53 | $77.22 | −$1,392.80 |
Strategy A$0.00
Trades0Win rate0.00%Profit factor0.00Average trade$0.00Max drawdown$0.00
Strategy B$4,515.20
Trades1,166Win rate42.37%Profit factor1.11Average trade$3.87Max drawdown−$2,475.80
Strategy C$19,090.20
Trades2,161Win rate42.43%Profit factor1.19Average trade$8.83Max drawdown−$4,541.50
Strategy D$24,102.50
Trades1,040Win rate55.77%Profit factor1.41Average trade$23.18Max drawdown−$2,703.00
Strategy E$26,396.20
Trades1,236Win rate58.33%Profit factor1.32Average trade$21.36Max drawdown−$3,072.00
Strategy F$0.00
Trades0Win rate0.00%Profit factor0.00Average trade$0.00Max drawdown$0.00
Strategy G$10,403.80
Trades224Win rate52.23%Profit factor1.81Average trade$46.45Max drawdown−$1,107.00
Strategy H$27,781.50
Trades1,715Win rate40.64%Profit factor1.21Average trade$16.20Max drawdown−$8,366.40
Strategy I$3,587.00
Trades330Win rate53.03%Profit factor1.22Average trade$10.87Max drawdown−$2,756.30
Strategy J$9,732.60
Trades717Win rate59.14%Profit factor1.28Average trade$13.57Max drawdown−$2,498.10
Strategy K$25,887.50
Trades957Win rate50.89%Profit factor1.44Average trade$27.05Max drawdown−$3,539.20
Strategy L$51,250.00
Trades1,374Win rate55.17%Profit factor1.44Average trade$37.30Max drawdown−$7,971.70
Strategy M$24,027.90
Trades1,691Win rate60.85%Profit factor1.30Average trade$14.21Max drawdown−$2,432.20
Strategy N$14,518.10
Trades188Win rate63.83%Profit factor2.53Average trade$77.22Max drawdown−$1,392.80
TRADE-SIZING PROFILE
50K
Net profit$483,278.00
Maximum drawdown−$15,680.50
Profit factor1.30
Winning trades43.43%
Closed trades27,914
Active sessions1,413
Results by testing period
AUG 2024 — SEP 2026
Out-of-sample period
$282,750.50Max drawdown−$15,680.50Win rate44.49%Profit factor1.39Closed trades11,170Average trade$25.31Active sessions582
MAR 2026 — SEP 2026
Recent backtest period
$59,489.50Max drawdown−$15,680.50Win rate42.99%Profit factor1.30Closed trades2,519Average trade$23.62Active sessions135
The recent backtest window is included within the out-of-sample date range.
Annual performance
| Year | Net profit | Trades | Win rate | Profit factor | Max drawdown | Active sessions |
|---|---|---|---|---|---|---|
| 2021 | $17,533.80 | 1,949 | 40.23% | 1.25 | −$4,443.80 | 115 |
| 2022 | $88,992.50 | 5,301 | 42.31% | 1.26 | −$13,701.50 | 277 |
| 2023 | $56,071.70 | 5,999 | 44.11% | 1.19 | −$11,122.70 | 278 |
| 2024 | $102,612.50 | 5,864 | 43.37% | 1.32 | −$14,276.20 | 282 |
| 2025 | $130,214.30 | 5,480 | 44.71% | 1.38 | −$12,089.40 | 282 |
| 2026 | $87,853.20 | 3,321 | 43.87% | 1.35 | −$15,680.50 | 179 |
2021$17,533.80
Trades1,949Win rate40.23%Profit factor1.25Max drawdown−$4,443.80Active sessions115
2022$88,992.50
Trades5,301Win rate42.31%Profit factor1.26Max drawdown−$13,701.50Active sessions277
2023$56,071.70
Trades5,999Win rate44.11%Profit factor1.19Max drawdown−$11,122.70Active sessions278
2024$102,612.50
Trades5,864Win rate43.37%Profit factor1.32Max drawdown−$14,276.20Active sessions282
2025$130,214.30
Trades5,480Win rate44.71%Profit factor1.38Max drawdown−$12,089.40Active sessions282
2026$87,853.20
Trades3,321Win rate43.87%Profit factor1.35Max drawdown−$15,680.50Active sessions179
Results by strategy
| Strategy | Trades | Win rate | Net profit | Profit factor | Average trade | Max drawdown |
|---|---|---|---|---|---|---|
| Strategy A | 4,360 | 34.91% | $19,362.50 | 1.16 | $4.44 | −$4,200.90 |
| Strategy B | 1,167 | 43.53% | $2,928.40 | 1.08 | $2.51 | −$2,541.10 |
| Strategy C | 2,321 | 41.75% | $14,584.70 | 1.15 | $6.28 | −$5,567.10 |
| Strategy D | 1,914 | 48.22% | $77,018.90 | 1.46 | $40.24 | −$5,072.80 |
| Strategy E | 1,399 | 52.75% | $29,921.40 | 1.22 | $21.39 | −$6,437.50 |
| Strategy F | 5,886 | 36.73% | $67,001.70 | 1.29 | $11.38 | −$5,840.10 |
| Strategy G | 374 | 39.57% | $8,931.30 | 1.45 | $23.88 | −$1,859.50 |
| Strategy H | 3,059 | 44.07% | $65,399.90 | 1.21 | $21.38 | −$17,587.30 |
| Strategy I | 563 | 52.75% | $14,449.20 | 1.31 | $25.66 | −$6,189.80 |
| Strategy J | 839 | 53.28% | $12,567.10 | 1.24 | $14.98 | −$3,376.40 |
| Strategy K | 1,810 | 52.87% | $59,574.90 | 1.46 | $32.91 | −$8,293.10 |
| Strategy L | 1,570 | 44.01% | $46,328.50 | 1.41 | $29.51 | −$6,989.00 |
| Strategy M | 2,375 | 52.88% | $38,395.90 | 1.28 | $16.17 | −$3,831.10 |
| Strategy N | 277 | 56.68% | $26,813.60 | 2.50 | $96.80 | −$2,947.70 |
Strategy A$19,362.50
Trades4,360Win rate34.91%Profit factor1.16Average trade$4.44Max drawdown−$4,200.90
Strategy B$2,928.40
Trades1,167Win rate43.53%Profit factor1.08Average trade$2.51Max drawdown−$2,541.10
Strategy C$14,584.70
Trades2,321Win rate41.75%Profit factor1.15Average trade$6.28Max drawdown−$5,567.10
Strategy D$77,018.90
Trades1,914Win rate48.22%Profit factor1.46Average trade$40.24Max drawdown−$5,072.80
Strategy E$29,921.40
Trades1,399Win rate52.75%Profit factor1.22Average trade$21.39Max drawdown−$6,437.50
Strategy F$67,001.70
Trades5,886Win rate36.73%Profit factor1.29Average trade$11.38Max drawdown−$5,840.10
Strategy G$8,931.30
Trades374Win rate39.57%Profit factor1.45Average trade$23.88Max drawdown−$1,859.50
Strategy H$65,399.90
Trades3,059Win rate44.07%Profit factor1.21Average trade$21.38Max drawdown−$17,587.30
Strategy I$14,449.20
Trades563Win rate52.75%Profit factor1.31Average trade$25.66Max drawdown−$6,189.80
Strategy J$12,567.10
Trades839Win rate53.28%Profit factor1.24Average trade$14.98Max drawdown−$3,376.40
Strategy K$59,574.90
Trades1,810Win rate52.87%Profit factor1.46Average trade$32.91Max drawdown−$8,293.10
Strategy L$46,328.50
Trades1,570Win rate44.01%Profit factor1.41Average trade$29.51Max drawdown−$6,989.00
Strategy M$38,395.90
Trades2,375Win rate52.88%Profit factor1.28Average trade$16.17Max drawdown−$3,831.10
Strategy N$26,813.60
Trades277Win rate56.68%Profit factor2.50Average trade$96.80Max drawdown−$2,947.70
TRADE-SIZING PROFILE
100K
Net profit$724,837.20
Maximum drawdown−$22,547.20
Profit factor1.30
Winning trades44.13%
Closed trades30,158
Active sessions1,413
Results by testing period
AUG 2024 — SEP 2026
Out-of-sample period
$426,577.50Max drawdown−$22,277.60Win rate45.46%Profit factor1.40Closed trades12,097Average trade$35.26Active sessions582
MAR 2026 — SEP 2026
Recent backtest period
$89,845.00Max drawdown−$22,277.60Win rate44.86%Profit factor1.32Closed trades2,744Average trade$32.74Active sessions135
The recent backtest window is included within the out-of-sample date range.
Annual performance
| Year | Net profit | Trades | Win rate | Profit factor | Max drawdown | Active sessions |
|---|---|---|---|---|---|---|
| 2021 | $31,660.70 | 2,117 | 40.86% | 1.30 | −$6,165.00 | 115 |
| 2022 | $124,427.90 | 5,722 | 42.75% | 1.25 | −$20,196.60 | 277 |
| 2023 | $87,202.70 | 6,466 | 44.51% | 1.20 | −$18,697.40 | 278 |
| 2024 | $154,228.80 | 6,326 | 44.06% | 1.32 | −$22,547.20 | 282 |
| 2025 | $194,376.90 | 5,918 | 45.44% | 1.39 | −$19,438.50 | 282 |
| 2026 | $132,940.20 | 3,609 | 45.55% | 1.37 | −$22,277.60 | 179 |
2021$31,660.70
Trades2,117Win rate40.86%Profit factor1.30Max drawdown−$6,165.00Active sessions115
2022$124,427.90
Trades5,722Win rate42.75%Profit factor1.25Max drawdown−$20,196.60Active sessions277
2023$87,202.70
Trades6,466Win rate44.51%Profit factor1.20Max drawdown−$18,697.40Active sessions278
2024$154,228.80
Trades6,326Win rate44.06%Profit factor1.32Max drawdown−$22,547.20Active sessions282
2025$194,376.90
Trades5,918Win rate45.44%Profit factor1.39Max drawdown−$19,438.50Active sessions282
2026$132,940.20
Trades3,609Win rate45.55%Profit factor1.37Max drawdown−$22,277.60Active sessions179
Results by strategy
| Strategy | Trades | Win rate | Net profit | Profit factor | Average trade | Max drawdown |
|---|---|---|---|---|---|---|
| Strategy A | 4,355 | 35.41% | $23,413.50 | 1.18 | $5.38 | −$5,569.10 |
| Strategy B | 1,463 | 44.02% | $8,277.50 | 1.11 | $5.66 | −$4,270.40 |
| Strategy C | 2,973 | 42.01% | $23,133.50 | 1.12 | $7.78 | −$12,182.40 |
| Strategy D | 1,908 | 48.58% | $103,021.30 | 1.46 | $53.99 | −$7,310.80 |
| Strategy E | 1,627 | 54.03% | $53,629.20 | 1.25 | $32.96 | −$9,660.50 |
| Strategy F | 5,881 | 38.29% | $77,138.20 | 1.33 | $13.12 | −$6,181.10 |
| Strategy G | 422 | 41.23% | $18,261.40 | 1.56 | $43.27 | −$2,161.50 |
| Strategy H | 3,161 | 44.07% | $92,039.50 | 1.21 | $29.12 | −$23,196.30 |
| Strategy I | 557 | 52.78% | $18,489.90 | 1.29 | $33.20 | −$8,617.80 |
| Strategy J | 920 | 52.72% | $18,643.30 | 1.22 | $20.26 | −$5,664.00 |
| Strategy K | 1,869 | 52.81% | $84,507.40 | 1.45 | $45.22 | −$11,445.10 |
| Strategy L | 1,842 | 45.39% | $95,462.00 | 1.41 | $51.83 | −$14,665.70 |
| Strategy M | 2,875 | 51.23% | $69,483.30 | 1.28 | $24.17 | −$6,377.50 |
| Strategy N | 305 | 57.05% | $39,337.20 | 2.45 | $128.97 | −$4,719.80 |
Strategy A$23,413.50
Trades4,355Win rate35.41%Profit factor1.18Average trade$5.38Max drawdown−$5,569.10
Strategy B$8,277.50
Trades1,463Win rate44.02%Profit factor1.11Average trade$5.66Max drawdown−$4,270.40
Strategy C$23,133.50
Trades2,973Win rate42.01%Profit factor1.12Average trade$7.78Max drawdown−$12,182.40
Strategy D$103,021.30
Trades1,908Win rate48.58%Profit factor1.46Average trade$53.99Max drawdown−$7,310.80
Strategy E$53,629.20
Trades1,627Win rate54.03%Profit factor1.25Average trade$32.96Max drawdown−$9,660.50
Strategy F$77,138.20
Trades5,881Win rate38.29%Profit factor1.33Average trade$13.12Max drawdown−$6,181.10
Strategy G$18,261.40
Trades422Win rate41.23%Profit factor1.56Average trade$43.27Max drawdown−$2,161.50
Strategy H$92,039.50
Trades3,161Win rate44.07%Profit factor1.21Average trade$29.12Max drawdown−$23,196.30
Strategy I$18,489.90
Trades557Win rate52.78%Profit factor1.29Average trade$33.20Max drawdown−$8,617.80
Strategy J$18,643.30
Trades920Win rate52.72%Profit factor1.22Average trade$20.26Max drawdown−$5,664.00
Strategy K$84,507.40
Trades1,869Win rate52.81%Profit factor1.45Average trade$45.22Max drawdown−$11,445.10
Strategy L$95,462.00
Trades1,842Win rate45.39%Profit factor1.41Average trade$51.83Max drawdown−$14,665.70
Strategy M$69,483.30
Trades2,875Win rate51.23%Profit factor1.28Average trade$24.17Max drawdown−$6,377.50
Strategy N$39,337.20
Trades305Win rate57.05%Profit factor2.45Average trade$128.97Max drawdown−$4,719.80
TRADE-SIZING PROFILE
150K
Net profit$1,422,859.20
Maximum drawdown−$45,172.10
Profit factor1.31
Winning trades43.85%
Closed trades31,854
Active sessions1,413
Results by testing period
AUG 2024 — SEP 2026
Out-of-sample period
$835,133.30Max drawdown−$43,663.60Win rate45.18%Profit factor1.41Closed trades12,754Average trade$65.48Active sessions582
MAR 2026 — SEP 2026
Recent backtest period
$175,766.60Max drawdown−$43,663.60Win rate44.70%Profit factor1.32Closed trades2,870Average trade$61.24Active sessions135
The recent backtest window is included within the out-of-sample date range.
Annual performance
| Year | Net profit | Trades | Win rate | Profit factor | Max drawdown | Active sessions |
|---|---|---|---|---|---|---|
| 2021 | $59,829.90 | 2,235 | 40.45% | 1.29 | −$11,625.50 | 115 |
| 2022 | $243,344.20 | 6,065 | 42.61% | 1.25 | −$39,933.90 | 277 |
| 2023 | $174,198.30 | 6,845 | 44.30% | 1.20 | −$36,005.60 | 278 |
| 2024 | $305,586.20 | 6,678 | 43.53% | 1.33 | −$45,172.10 | 282 |
| 2025 | $382,094.90 | 6,250 | 45.07% | 1.39 | −$38,127.50 | 282 |
| 2026 | $257,805.70 | 3,781 | 45.62% | 1.37 | −$43,663.60 | 179 |
2021$59,829.90
Trades2,235Win rate40.45%Profit factor1.29Max drawdown−$11,625.50Active sessions115
2022$243,344.20
Trades6,065Win rate42.61%Profit factor1.25Max drawdown−$39,933.90Active sessions277
2023$174,198.30
Trades6,845Win rate44.30%Profit factor1.20Max drawdown−$36,005.60Active sessions278
2024$305,586.20
Trades6,678Win rate43.53%Profit factor1.33Max drawdown−$45,172.10Active sessions282
2025$382,094.90
Trades6,250Win rate45.07%Profit factor1.39Max drawdown−$38,127.50Active sessions282
2026$257,805.70
Trades3,781Win rate45.62%Profit factor1.37Max drawdown−$43,663.60Active sessions179
Results by strategy
| Strategy | Trades | Win rate | Net profit | Profit factor | Average trade | Max drawdown |
|---|---|---|---|---|---|---|
| Strategy A | 4,796 | 35.63% | $44,003.50 | 1.17 | $9.18 | −$10,355.50 |
| Strategy B | 1,474 | 44.30% | $12,099.00 | 1.11 | $8.21 | −$6,812.10 |
| Strategy C | 2,987 | 41.98% | $33,201.80 | 1.11 | $11.12 | −$18,483.90 |
| Strategy D | 1,987 | 48.16% | $203,574.50 | 1.46 | $102.45 | −$13,966.20 |
| Strategy E | 1,665 | 53.99% | $106,423.80 | 1.25 | $63.92 | −$18,717.00 |
| Strategy F | 6,496 | 37.65% | $152,841.70 | 1.33 | $23.53 | −$12,673.00 |
| Strategy G | 435 | 41.15% | $36,681.30 | 1.57 | $84.32 | −$4,416.70 |
| Strategy H | 3,253 | 44.08% | $180,863.40 | 1.20 | $55.60 | −$46,774.70 |
| Strategy I | 577 | 52.86% | $37,689.60 | 1.30 | $65.32 | −$17,403.30 |
| Strategy J | 950 | 52.95% | $35,670.00 | 1.22 | $37.55 | −$11,052.60 |
| Strategy K | 1,917 | 52.43% | $171,237.50 | 1.45 | $89.33 | −$24,773.50 |
| Strategy L | 1,902 | 45.16% | $186,406.20 | 1.41 | $98.01 | −$28,285.10 |
| Strategy M | 3,089 | 51.21% | $144,131.00 | 1.28 | $46.66 | −$13,755.70 |
| Strategy N | 326 | 56.44% | $78,035.90 | 2.46 | $239.37 | −$9,444.60 |
Strategy A$44,003.50
Trades4,796Win rate35.63%Profit factor1.17Average trade$9.18Max drawdown−$10,355.50
Strategy B$12,099.00
Trades1,474Win rate44.30%Profit factor1.11Average trade$8.21Max drawdown−$6,812.10
Strategy C$33,201.80
Trades2,987Win rate41.98%Profit factor1.11Average trade$11.12Max drawdown−$18,483.90
Strategy D$203,574.50
Trades1,987Win rate48.16%Profit factor1.46Average trade$102.45Max drawdown−$13,966.20
Strategy E$106,423.80
Trades1,665Win rate53.99%Profit factor1.25Average trade$63.92Max drawdown−$18,717.00
Strategy F$152,841.70
Trades6,496Win rate37.65%Profit factor1.33Average trade$23.53Max drawdown−$12,673.00
Strategy G$36,681.30
Trades435Win rate41.15%Profit factor1.57Average trade$84.32Max drawdown−$4,416.70
Strategy H$180,863.40
Trades3,253Win rate44.08%Profit factor1.20Average trade$55.60Max drawdown−$46,774.70
Strategy I$37,689.60
Trades577Win rate52.86%Profit factor1.30Average trade$65.32Max drawdown−$17,403.30
Strategy J$35,670.00
Trades950Win rate52.95%Profit factor1.22Average trade$37.55Max drawdown−$11,052.60
Strategy K$171,237.50
Trades1,917Win rate52.43%Profit factor1.45Average trade$89.33Max drawdown−$24,773.50
Strategy L$186,406.20
Trades1,902Win rate45.16%Profit factor1.41Average trade$98.01Max drawdown−$28,285.10
Strategy M$144,131.00
Trades3,089Win rate51.21%Profit factor1.28Average trade$46.66Max drawdown−$13,755.70
Strategy N$78,035.90
Trades326Win rate56.44%Profit factor2.46Average trade$239.37Max drawdown−$9,444.60
HOW THESE FIGURES WERE CALCULATED
31,854 closed trades from the supplied combined NinjaTrader export, grouped by exit date and strategy entry ID. These performance figures are based on historical backtesting from August 1, 2021 through September 1, 2026. The out-of-sample testing period ran from August 1, 2024 through September 1, 2026. Net profit uses the exported Profit values; commissions and slippage are included in all reported trade results and are not deducted a second time. Maximum drawdown is computed from the daily cumulative equity series. The export also includes the March 1, 2026 through September 1, 2026 window shown in the period breakdown.
Historical, simulated, and backtested results do not guarantee future performance. Futures trading involves substantial risk.
Supporting trade records: View trade-level CSVs for all four sizing profiles.